
School Performance Data
Herbert Morrison Primary School Summary Data 25/26 for
Pupils Achieving at the Expected Standard and at the Higher Standard
Compared to Lambeth and National Results
Please find below, for your information, standard of achievement at Foundation Stage Profile, Phonics, KS1 and KS2.
Highlighted GREEN if school results broadly in line with or above National/Lambeth
Early Years Foundation Stage Profile
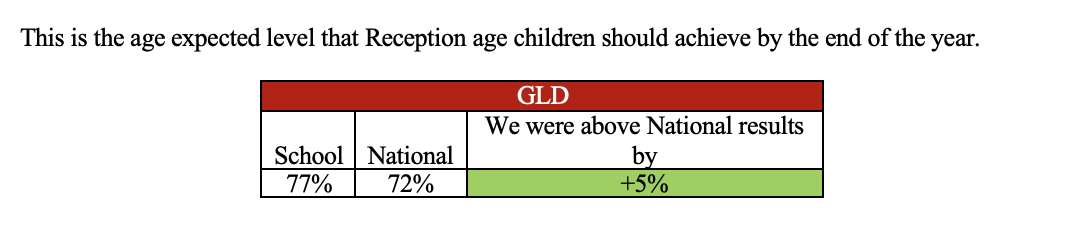
Table 1. Percentage Achieving a Good Level of Development (GLD)
Year 1 Phonics Screening Check
Table 2. Percentage of Pupils Working At (Wa) or above the expected standard

Standards at Key Stage 1
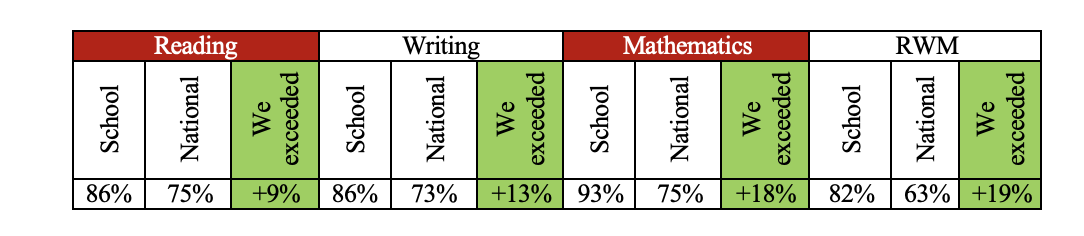
Table 3. Percentage of Pupils Achieving the Expected Standard at KS1

Standards at Key Stage 2
Table 4. Percentage of Pupils Achieving the Expected Standard at KS2
Pupil Premium
- In Reading, pupils not eligible for Free School Meals (nFSM) achieved above with their non-FSM peers.
- In Maths, non-FSM pupils outperformed FSM pupils by 3%.
- In Teacher Assessed Writing, non-FSM pupils outperformed FSM pupils by 9%.
- Class profile: 17 FSM pupils and 11 non-FSM pupils.
FSM pupil outcomes compared with Lambeth averages:
- Reading: +9% above the Lambeth average
- Maths: +22% above the Lambeth average
- Writing: +13% above the Lambeth average
- Combined Reading, Writing and Maths: +23% above the Lambeth average
Pupils achieving at the Higher Standard
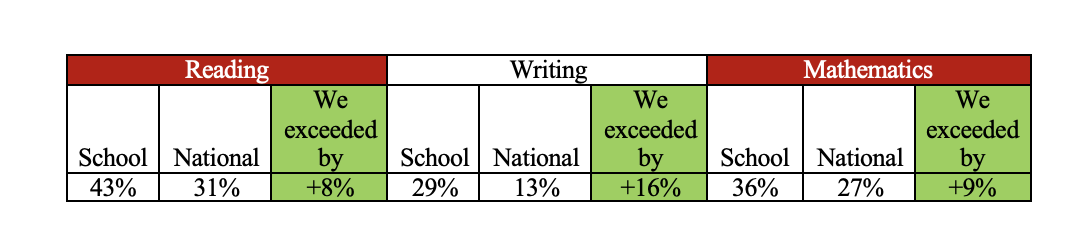
Table 5. Percentage of Pupils Achieving the Higher Standard at KS1

Table 6. Percentage of Pupils Achieving the Higher Standard at KS2
Scaled scores at Key Stage 2
In the KS2 Reading Test - pupils scored an average of +4 scale points higher than pupils nationally
In the KS2 Spelling, Punctuation and Grammar - pupils scored an average of +4 scale points higher than pupils nationally.
In the KS2 Mathematics Test - pupils scored an average of +4 scale points higher than pupils nationally.